
No products in the cart.
Email Marketing
Key Insights From the 2022 Email Marketing Benchmarks Report

29
Apr
Apr
Do you want to make sure your email campaigns resonate with your audience and remain impactful in 2022?
Then look no further and dive right into this freshly updatedEmail Marketing Benchmarksreport that analyzed more than 7 billion emails sent by our customers throughout 2021.
Inside, you’ll find the latest statistics on email marketing, landing pages, webinar marketing, and insights from our in-house experts. With these, you’ll be ready to make better-informed decisions regarding your marketing communications.
Below, you have an insightful snapshot of the key findings and their meaning for your business.
Table Of Contents
What’s new in this report?
We didn’t just update the data for 2021! We’ve also added new, useful sections to help you plan your online marketing campaigns even better!
Here’s what’s new:
Also, we’ve added the average bounce rate data throughout the whole report. This information will help you better understand how healthy your email campaigns are compared to others.
1. Don’t rely solely on email open rates
As you may recall, last yearApple introduced some significant changes to its privacy policies that affect email marketers’ ability to track message opens.
This change makes it harder for email marketing professionals to measure their email lists’ health and – perhaps more importantly – to set up automated campaigns based on recipients’ engagement.
Mail Privacy Protection from Apple lets the users choose whether they want their email activity to be tracked. Source: WNIP
While it’s still too early to say how impactful these changes are, in our month-to-month analysis, we observed a significant spike in email open rates (and a drop in email CTRs) in the last two months of 2021 – which coincides with the introduction of Apple’s changes.
 Average email marketing statistics month by month 2021
And what did we observe in the past? Looking back at our 2020 data, there was a different trend within the same period – a drop in both email opens and clicks, which would seem more natural as the competition is usually fiercer in the holiday sales season.
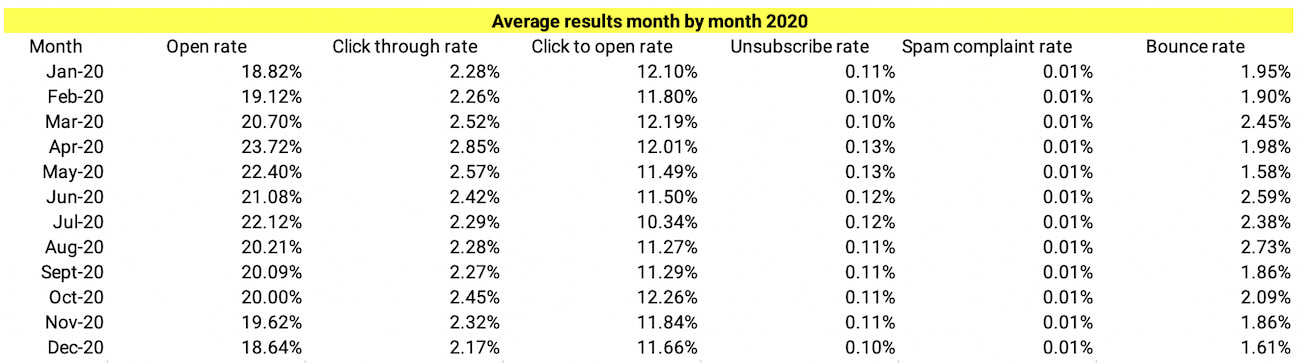 Average email marketing statistics month by month 2020
What this means:
While email open rates are still helpful for tracking your campaigns’ performance, you shouldn’t be overdependent on them. Consider other metrics, especially the click-through rate, and actively motivate your subscribers to manage their email preferences.
read more: Email marketing KPIs and metrics explained
2. Continue to invest in email automation
Using automated campaigns continues to be the best solution if you want to drive high click-through and click-to-open rates.
We looked at various types of communication – welcome emails, triggered emails, autoresponders, RSS, and even webinar reminders. They all outperform regular newsletters both in terms of opens and clicks.
Message typeAverage open rateAverage click-through rateWelcome email68.59%16.05%Triggered email35.64%5.31%Autoresponder29.95%3.77%RSS31.01%5.67%Webinar invite27.73%3.68%Webinar reminder – sent at start time88.77% 22.15%Webinar reminder – sent 5 minutes before the webinar90.85%25.12%Webinar reminder – sent 30 minutes before the webinar88.64%39.07%Webinar reminder – sent 1 hour before the webinar91.48%28.98%Webinar reminder – sent 1 day before the webinar89.55%15.29%The effectiveness of different types of automated emails.
But high engagement and conversions aren’t the only benefits you can expect from implementing email automation. Triggered campaigns can also improve your email deliverability, sometimes referred to as inbox placement.
 Example of a welcome email containing a coupon code sent by an ecommerce brand CatCaboodle
Bad email deliverability can make all your efforts futile. If your emails don’t reach your subscribers’ inboxes, it won’t matter how good-looking or well-written they are.
What this means:
Even though Apple’s changes can affect the accuracy with which we can send triggered campaigns, implementing email automation is still the best decision you can make in 2022.
If you haven’t used it yet, you can start simply by building out a welcome email or an onboarding series to help you nurture and engage your new leads.
Per tip:You can read more about how Landcafe.pl, an ecommerce company selling coffee, generates 54% of its sales with a highly-educational onboarding email campaign.
3. Think long-term and avoid shortcuts
Email marketers often look for quick-win solutions to help them achieve their business goals – this is especially true for writing subject lines.
The internet is full of advice that says by adding a particular phrase, emoji, personalization, or a number you’ll be able to drive higher opens.
We’ve already discussed that this metric – email open rate – isn’t an ideal one. But do the above-mentioned tactics help you “hack” it?
We’ve looked at our data, and it seems that using emojis or simple personalization no longer gives you a head start over your competition. This may come as a surprise, but the potential reason may be that customers have become more used to or are even slightly annoyed by tactics designed to capture their attention.
It could also mean that this previously successful method is being employed by brands across the board now, so they don’t stand out in the way they used to.
 The effect of personalization on open rates in email subject lines
 The effect of emojis on open rates in email subject lines
When it comes to using particular phrases, we don’t see any rules that could help you game the system. Apart from the terms that are mostly associated with sketchy email marketing practices (such as using “re:” or “fwd” in marketing emails), there seems to be no correlation with what does or doesn’t work.
 The effect of various phrases on email subject lines
What this means:
Think of email marketing as a long-term game where you first have to earn your recipients’ trust, and then keep delighting them with relevant content.
If you keep the promise you made in your newsletter signup forms, you won’t need to take shortcuts that don’t provide real value to your audience.
4. Make your communication accessible to everyone
We’ve long known that mobile consumers make up about half of your online audience.
Regarding email clicks (the more accurate of the key email metrics), we see that 45.97% of them come from mobile devices.
 Mobile and desktop email clients break down by opens and clicks. Note: The open data is less accurate due to automated opens reported by some of the providers, including Apple
Once you’re aware of these numbers, the decision todesign your emails according to the best practicesis an obvious one.
But don’t stop there. Make sure your emails, landing pages, chats, and even webinars are accessible to everyone.
For webinars specifically, we already see that 37.92% of all attendees view them on mobile devices.
 Webinar attendees breakdown by device type
What this means:
Make sure everyone can access your marketing communication.
Start by optimizing it for mobile devices – choosing the suitable layouts, font sizes, providing ALT text, etc.
Think broader once you’ve mastered this and follow ouremail accessibility checklist. It’ll help you ensure that everyone can consume your campaigns, no matter their hardware, software, language, location, or ability.
5. Always start your analysis by understanding the context
Finally, once again in our report, we noticed that the average email marketing statistics vary based on several factors.
For example:
- Where you’re located
- What industry you’re in
- How big your email list is
- Where your audience lives
- What content you’re promoting
- How often you’re sending your communication
 Email engagement rates by continent
 Email engagement rates by industry
The differences are sometimes minor, but more often than not, they’re significant. Being aware of how impactful these factors are can help you better understand the condition of your email marketing program.
What this means:
Consider this data as an inspiration for your own tests and analysis. Compare your results to those you had last month or even a year ago, and check whether the trends you’re seeing correlate with what’s visible on the market.
What to do next
Email marketing is always evolving, so it’s worth keeping an eye on the latest trends and developments.
Come back to this article, as we’ll keep adding new insights from our email marketing benchmarksreport.
Once you’ve set a goal you’d like to achieve with your email statistics, take a look at this guide that contains 20 tipson how you can improve your opens, clicks, unsubscribes, and spam complaint rates.
To learn more how you can up your email marketing game, visit the GetResponse Resources.
Have a question – or need feedback? Just leave a comment below.
Good luck!