
No products in the cart.
Social Media Marketing
34 Instagram Stats Entrepreneurs Have to Know in 2023

30
Jan
Jan
Instagram in 2023 is a quickly evolving social platform, with features changing and moving and disappearing at a sometimes dizzying rate.
Rather than chasing platform updates from Meta, ground yourself in hard data that shows what exactly Instagram is right now and how it’s likely to change in the year to come.
These 34 Instagram statistics paint a picture of a platform with a shifting audience that’s nonetheless holding its own in a crowded social landscape. You’ll find some valuable insights for planning your Instagram marketing strategy this year.
Bonus: Download a free checklist that reveals the exact steps a fitness influencer used to grow from 0 to 600,000+ followers on Instagram with no budget and no expensive gear.
General Instagram stats
1. Instagram is the 8th most visited website in the world
According to Semrush, based on total website traffic, Instagram is one of the world’s top 10 most-visited websites globally, with 4.25 billion total visits per month.
Importantly, while most users login through the mobile app, this stat is a good reminder that people may be viewing your posts on their desktops or laptops, too. That means you can’t count on everyone seeing features that are only available in the app, like product tags. It’s worth mentioning product names in your captions so web users can track them down if they’re inspired to buy.
2. Instagram is the 9th most-Googled search term
Facebook, Youtube and “weather” all beat out Instagram, but considering that Insta is primarily accessed through the app, this is an impressive number and more proof that your audience might be viewing your content through a browser — whether a mobile one or on their computer.
3. Instagram is the 4th most-used social platform
Only Facebook, Youtube and WhatsApp beat out Instagram in terms of daily global active users, as Instagram clocks in at an impressive 1.386 billion people.
For now, it’s beating out TikTok, Twitter, Pinterest and Snapchat, but 2023 will be a year of big change, as TikTok is gaining ground fast.
4. Just 0.1% of Instagram users only use Instagram
The likelihood that an Instagram user also has an account on another social platform is 99.9%. 83% of Instagram users, for example, are Facebook users, while 56% are also on Twitter and 52% also use TikTok.
(Conversely, 81% of TikTokers also use Instagram.)
What does this mean for marketers? You’re likely reaching the same people across different platforms. Make sure your content is unique, engaging, and relevant for followers on each platform with a strategic cross-platform campaign.
5. Instagram is the most-downloaded app in the world
TikTok comes in at second place, followed by Facebook and WhatsApp. Considering the Instagram app has been around since 2010, that’s an impressive spot on the download charts.
Instagram user stats
6. Instagram has more than 2 billion active monthly users
We said above that 1.386 billion use Instagram daily – but more than 2 billion now use the platform monthly, according to the latest Meta earnings call.
We’ll dive into how some of the top demographics that make up that huge user base in the following Instagram users statistics.
7. Instagram’s audience is 52.2% male
And 47.8% female. (For now, male and female are the only gender options available for Meta reporting.)
This is a change from previous years, when the audience was slightly dominated by women. It’s an important platform no matter which gender(s) you’re trying to reach.
8. 47% of American adults use Instagram
Pew Research found that nearly half of Americans aged 18+ use Instagram. And Forrester found that 40% of U.S. adults use Instagram at least weekly. Message to marketers: It’s not all about Gen Z. That said…
9. Instagram is Gen Z’s favorite social platform
Global internet users aged 16 to 24 prefer Instagram to all other social platforms — even ranking it above TikTok. If that’s an age cohort you’re looking to reach, Insta is the place to be.
It’s also the favorite platform for women aged 25 to 34, although men in that cohort prefer Facebook.
10. 61% of 12-to-17-year-olds use Instagram weekly
That’s an increase of 4 percentage points from last year. Meanwhile, Facebook use in this demographic is declining (to 40%), and TikTok use is growing fastest of all (to 69%).
Social media use is clearly shifting in this demographic, so if you’re marketing to teenagers, you’ll need to stay on your toes. A solid social listening strategy can help.
11. India has the most Instagram users in the world
This is a great reminder that Instagram offers access to a global audience, with 249 million users logging in from India (followed by the U.S. at 147 million).
In the third place spot, you’ll find Brazil, with 117 million users, followed by Indonesia and Turkey.
This is important information when thinking about how to define your target audience on Instagram, and what kind of content to create.
Instagram usage stats
12. Users spend an average of 11.7 hours/month on Instagram
It ranks fifth among social platforms, behind YouTube, TikTok, Facebook, and WhatsApp. But no matter how you slice it, that’s almost half a day every month spent consuming content on the platform.
13. Americans spend 30.1 minutes per day on Instagram
That’s exactly tied with Facebook, but behind TikTok, YouTube, Twitter, and Snapchat.
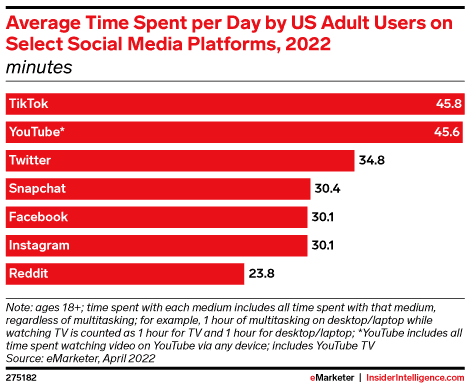
Source: eMarketer
Let’s put that into context:
14. Instagram accounted for 17% of the time U.S. adults spent on social media in 2022
eMarketer expects this to grow to 18.6% in 2024. In 2022 Instagram still beat TikTok for percentage of time spent, but by 2024 they’ll be tied.

Source: eMarketer
This chart shows how quickly things can change on the social media front, with TikTok coming out of nowhere. For now, TikTok’s gains seem to be coming from a loss of time spent on Facebook, rather than eating into Instagram’s share (which continues to grow).
Nonetheless, it’s a good reminder that you should never become overly reliant on a single social platform or strategy. Spread your eggs over multiple baskets to help future-proof your social marketing strategy.
Instagram Story stats
15. The potential ad audience on Instagram Stories is 996 million
For reference, you can potentially reach 1.32 billion users on the main feed. Does that mean main feed is a better ad bet? Not necessarily. It all depends where your audience spends most of their time.
Instagram analytics can help you figure out whether Stories or main feed posts get more attention from your audience. While this isn’t the only factor to consider when planning Instagram ad placement, it’s a useful data point to have on hand.
16. The most active brands post 17 Stories per month
There’s an important lesson here for overworked social media managers: Give yourself a break. If the most active brands are posting stories about every other day, you can feel confident saying no to a boss who expects daily Stories content.
Instagram Reels stats
17. The potential ad audience on Reels is 758.5 million users
Again, for reference, feed ads can reach up to 1.32 billion, and Stories ads can reach up to 996 million. Expect this to change in the coming year as Reels ads become more mainstream.
18. People reshare Reels 1 billion times a day through DMs
Through DMs! Dark social is real. Reels are well established as the best Instagram surface for getting in front of Instagram users who do not already follow your account. This is just another way in which Reels can expand your reach.
19. Reels take up 30% of the time people spend on Instagram
And this number is growing fast, up 50% from the 20% reported in Meta’s Q2 2022 earnings call. If you don’t yet have an Instagram Reels strategy in place, make 2023 your year to break into the short-form Instagram video scene.
20. 21% of U.S. Gen Z adults use Reels weekly
Instagram Reels statistics for Gen Z use pale in comparison to the 53% of the same demographic who use TikTok every week. But it’s still a substantial portion of young people consuming short-form video on Instagram.
This, combined with the Instagram user statistics above that showed substantial overlap between Instagram and TikTok audiences, means you can’t get away with just posting your TikToks to Reels and hoping for the best. Just to drive it home again, it’s always a best practice to create unique content for each platform.
21. Reels accounted for 5.4% of Instagram ad impressions between Thanksgiving and Cyber Monday
That’s still a small percentage, but it’s an astonishing increase from just 0.9% during this incredibly important shopping period last year. Reels ads are still relatively new and offer a good chance for experimentation and testing.
22. 15 of the top 20 most used songs globally on Instagram Reels are by Indian artists
We said above that India has more Instagram users than any other country, which certainly contributes to this statistic.
Instagram analytics can help you understand where your own audience is based. Don’t assume your followers all live in the same country (or even continent) as you do, or that their cultural experiences are the same as your own.
Social is a global medium, which is all the more reason to create a diverse social team within your organization.

Source: Meta
Instagram stats for business
23. Instagram is the #1 social media platform for people to connect with brands
This stat comes from a Meta-commissioned Ipsos Marketing study. The exact phrasing is “people surveyed said Instagram is the #1 place to keep up with their favorite brands compared to other platforms.” What exactly this means may be open to interpretation, but it certainly shows that people interested in your brand expect to find you on Instagram.
24. The average Instagram business account grows its followers by 0.98% each month
Of course, this varies significantly by industry. Here are some industry-specific Instagram follower growth stats benchmarks:
- Education: 0.03%
- Entertainment and media: -1.59%
- Financial services: -0.07%
- Food and beverage: -0.88%
- Real estate: -0.06%
- Retail: -0.37%
- Travel/hospitality/leisure: 0.33%
Notice that growth is negative right now for many industries – so don’t be alarmed if you’ve seen your own follower count drop a little in recent months. To counteract the trend, check out our tips for growing your Instagram followers here.
25. Business accounts post an average of 1.71 feed posts a day
To break that down: for the average Instagram Business account, 48.9% of all main feed posts are photos, while 31.8% are videos and 19.3% are carousel posts.
It’s worth noting that the percentage of video posts almost doubled from 16.3% last year. If you’re still focused only on photos when posting on Instagram, it may be time to modernize your content strategy.
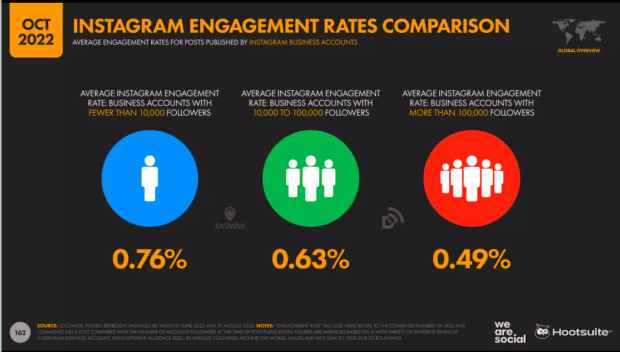
26. The average engagement rate on Instagram business account posts is 0.54%
That skews a little higher on video posts (0.61%) and a little lower on photos (0.46%), but if you’re beating that benchmark of 0.54%, pat yourself on the back.
Interestingly, engagement rate changes in conjunction with a brand’s Instagram follower stats. As brands grow their followers, engagement rates typically dip. Our digital trends report revealed the that business accounts with fewer than 10K followers enjoyed higher engagement rates than brands with 100K+ followers.
Looking for inspiration to grow your engagement beyond that? We’ve got you covered with Instagram engagement tips right here.
27. 35% of Instagram users will make a purchase on the platform in 2023
That’s just behind Facebook and TikTok, both of which will see a purchase percentage of 37%.
But percentages don’t tell the whole story because of the varying user numbers for each platform. Here’s how it breaks down in terms of actual people making purchases on each social network:
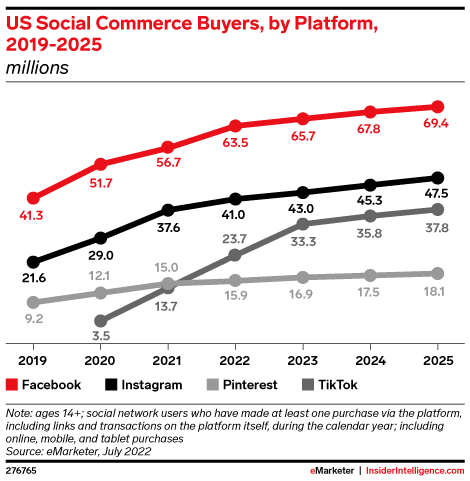
Source: eMarketer
Keep in mind that purchasing behaviors also vary by demographic. For Gen Z, Instagram is the top social commerce platform.
28. 15% of U.S. shoppers start their online shopping searches on Instagram
TikTok made news this year as the preferred search engine among younger Internet users. But for now, Instagram still ranks higher as a platform for starting an online shopping search. For comparison, TikTok is the platform of choice for 11% of Americans beginning their shopping searches.
29. Instagram accounts for 7.51% of web traffic referrals from social media
That might not sound like a lot, but it’s actually the third-ranked platform behind Facebook and Twitter. (Facebook is the runaway leader in this category with 71.64%.)
The more important detail here is that Instagram’s share of web traffic grew 88.2% last year, while Facebook’s shrank 0.8%. Instagram used to have a real shortage of ways to link out to websites, but that’s dramatically changed with shopping features like link stickers and tags. Watch for this figure to continue to grow.
30. Only 25% of Instagram users think the the platform protects their privacy and data
That’s a significant drop from 41% in 2020. Oddly, given that Instagram falls under the Meta umbrella, it’s still trusted by more people than Facebook (18%).
This is important for marketers because trust is an important element of social commerce.
Not surprisingly, the percentage of people who say they feel safe using the platform is also dropping, from 50% in 2020 to 36% in 2022. That puts it about in the middle of the pack when it comes to social trust.
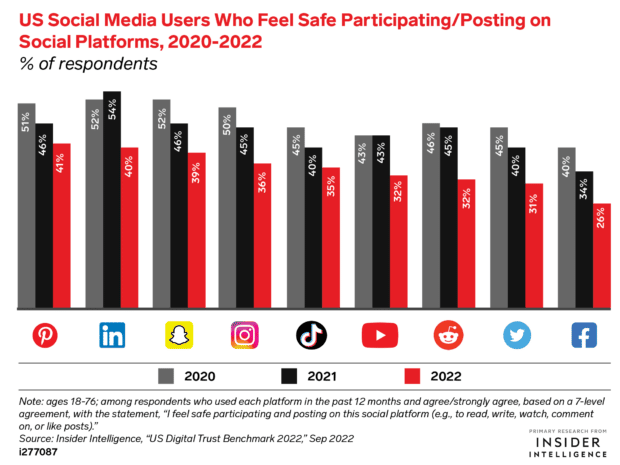
Source: eMarketer
Instagram ad stats
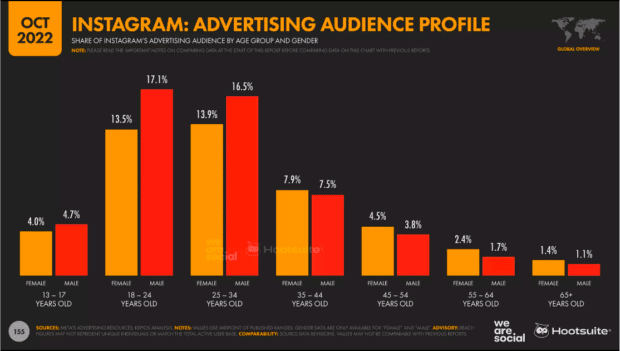
31. 61% of Instagram’s advertising audience is aged 18 to 34
Here are the specifics of how it breaks down by age and gender.
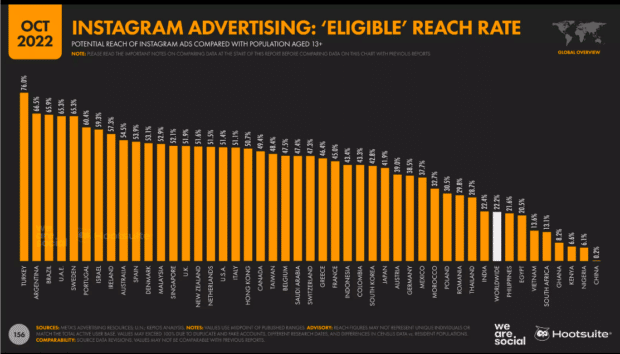
32. Instagram ads can reach 76% of the population aged 13+ in Turkey
That’s the highest ad penetration in the world, followed by 66.5% in Argentina and 65.9% in Brazil.
For comparison, Instagram’s ad penetration in the U.S. is 51.4%. The UK and Canada come in at 51.9% and 49.4%, respectively.
Yet again we see that while Instagram is a global medium, it’s not the same around the globe.
33. Instagram’s ad revenue is predicted to be $50.58 billion in 2023
That’s still behind Facebook’s $71.32 billion, but Instagram’s share of the Meta advertising pie is increasing steadily.
That’s because Facebook’s ad revenues are falling, while Instagram’s continue to increase. eMarketer predicts Instagram’s ad revenue will grow 12.1% this year while Facebook’s falls 1.2%.

Source: eMarketer
34. Instagram ads’ CPM increased 17% in Q3 2022
In the last two years, they increased 55%.
It’s getting more expensive to reach your audience through Instagram, which makes it ever more important to understand your audience and make the most of the available ad targeting options.
Save time managing your Instagram presence using Hootsuite. From a single dashboard, you can schedule and publish Instagram posts, Stories, and Reels, answer comments and DMs, track performance, and run all your other social media profiles. Try it free today.
Grow on Instagram
Easily create, analyze, and schedule Instagram posts, Stories, and Reels with Hootsuite. Save time and get results.